

בדף הזה מוסבר איך להטמיע לוח בקרה משולב למעקב אחרי כמה סביבות של Managed Airflow בפרויקטים נבחרים באותו ארגון.
סקירה כללית
הפתרון שמתואר כאן יכול לעזור לצוותים של פלטפורמות מרכזיות בארגונים לתמוך בסביבות Managed Airflow שבהן משתמשים צוותים אחרים. אפשר להשתמש בהטמעה הזו כדי לעקוב אחרי כל סביבות Managed Airflow, גם כאלה שלא נוצרו באמצעות Terraform.
במדריך הזה מוסבר איך להטמיע את לוח הבקרה של Cloud Monitoring ב-Managed Airflow, יחד עם מדיניות התראות שמדווחת באופן רציף על מדדי מפתח של סביבות Managed Airflow, ומעלה אירועים במקרה של בעיות. לוח הבקרה סורק אוטומטית את כל סביבות Managed Airflow בפרויקטים שנבחרו לצורך המעקב הזה. ההטמעה מתבססת על Terraform.
המודל משתמש ב Cloud de Confiance by S3NS פרויקט שמשמש כפרויקט מעקב, שמשמש למעקב (קריאה בלבד) אחרי סביבות Managed Airflow שנפרסו בכמה פרויקטים מפוקחים. כדי להציג את התוכן שלו, לוח הבקרה המרכזי משתמש במדדים של Cloud Monitoring מתוך הפרויקטים שבמעקב.

לוח הבקרה עוקב אחרי מדדים שונים ויוצר התראות לגביהם, כולל מצב הסביבה:

או מדדי מעבד (CPU):
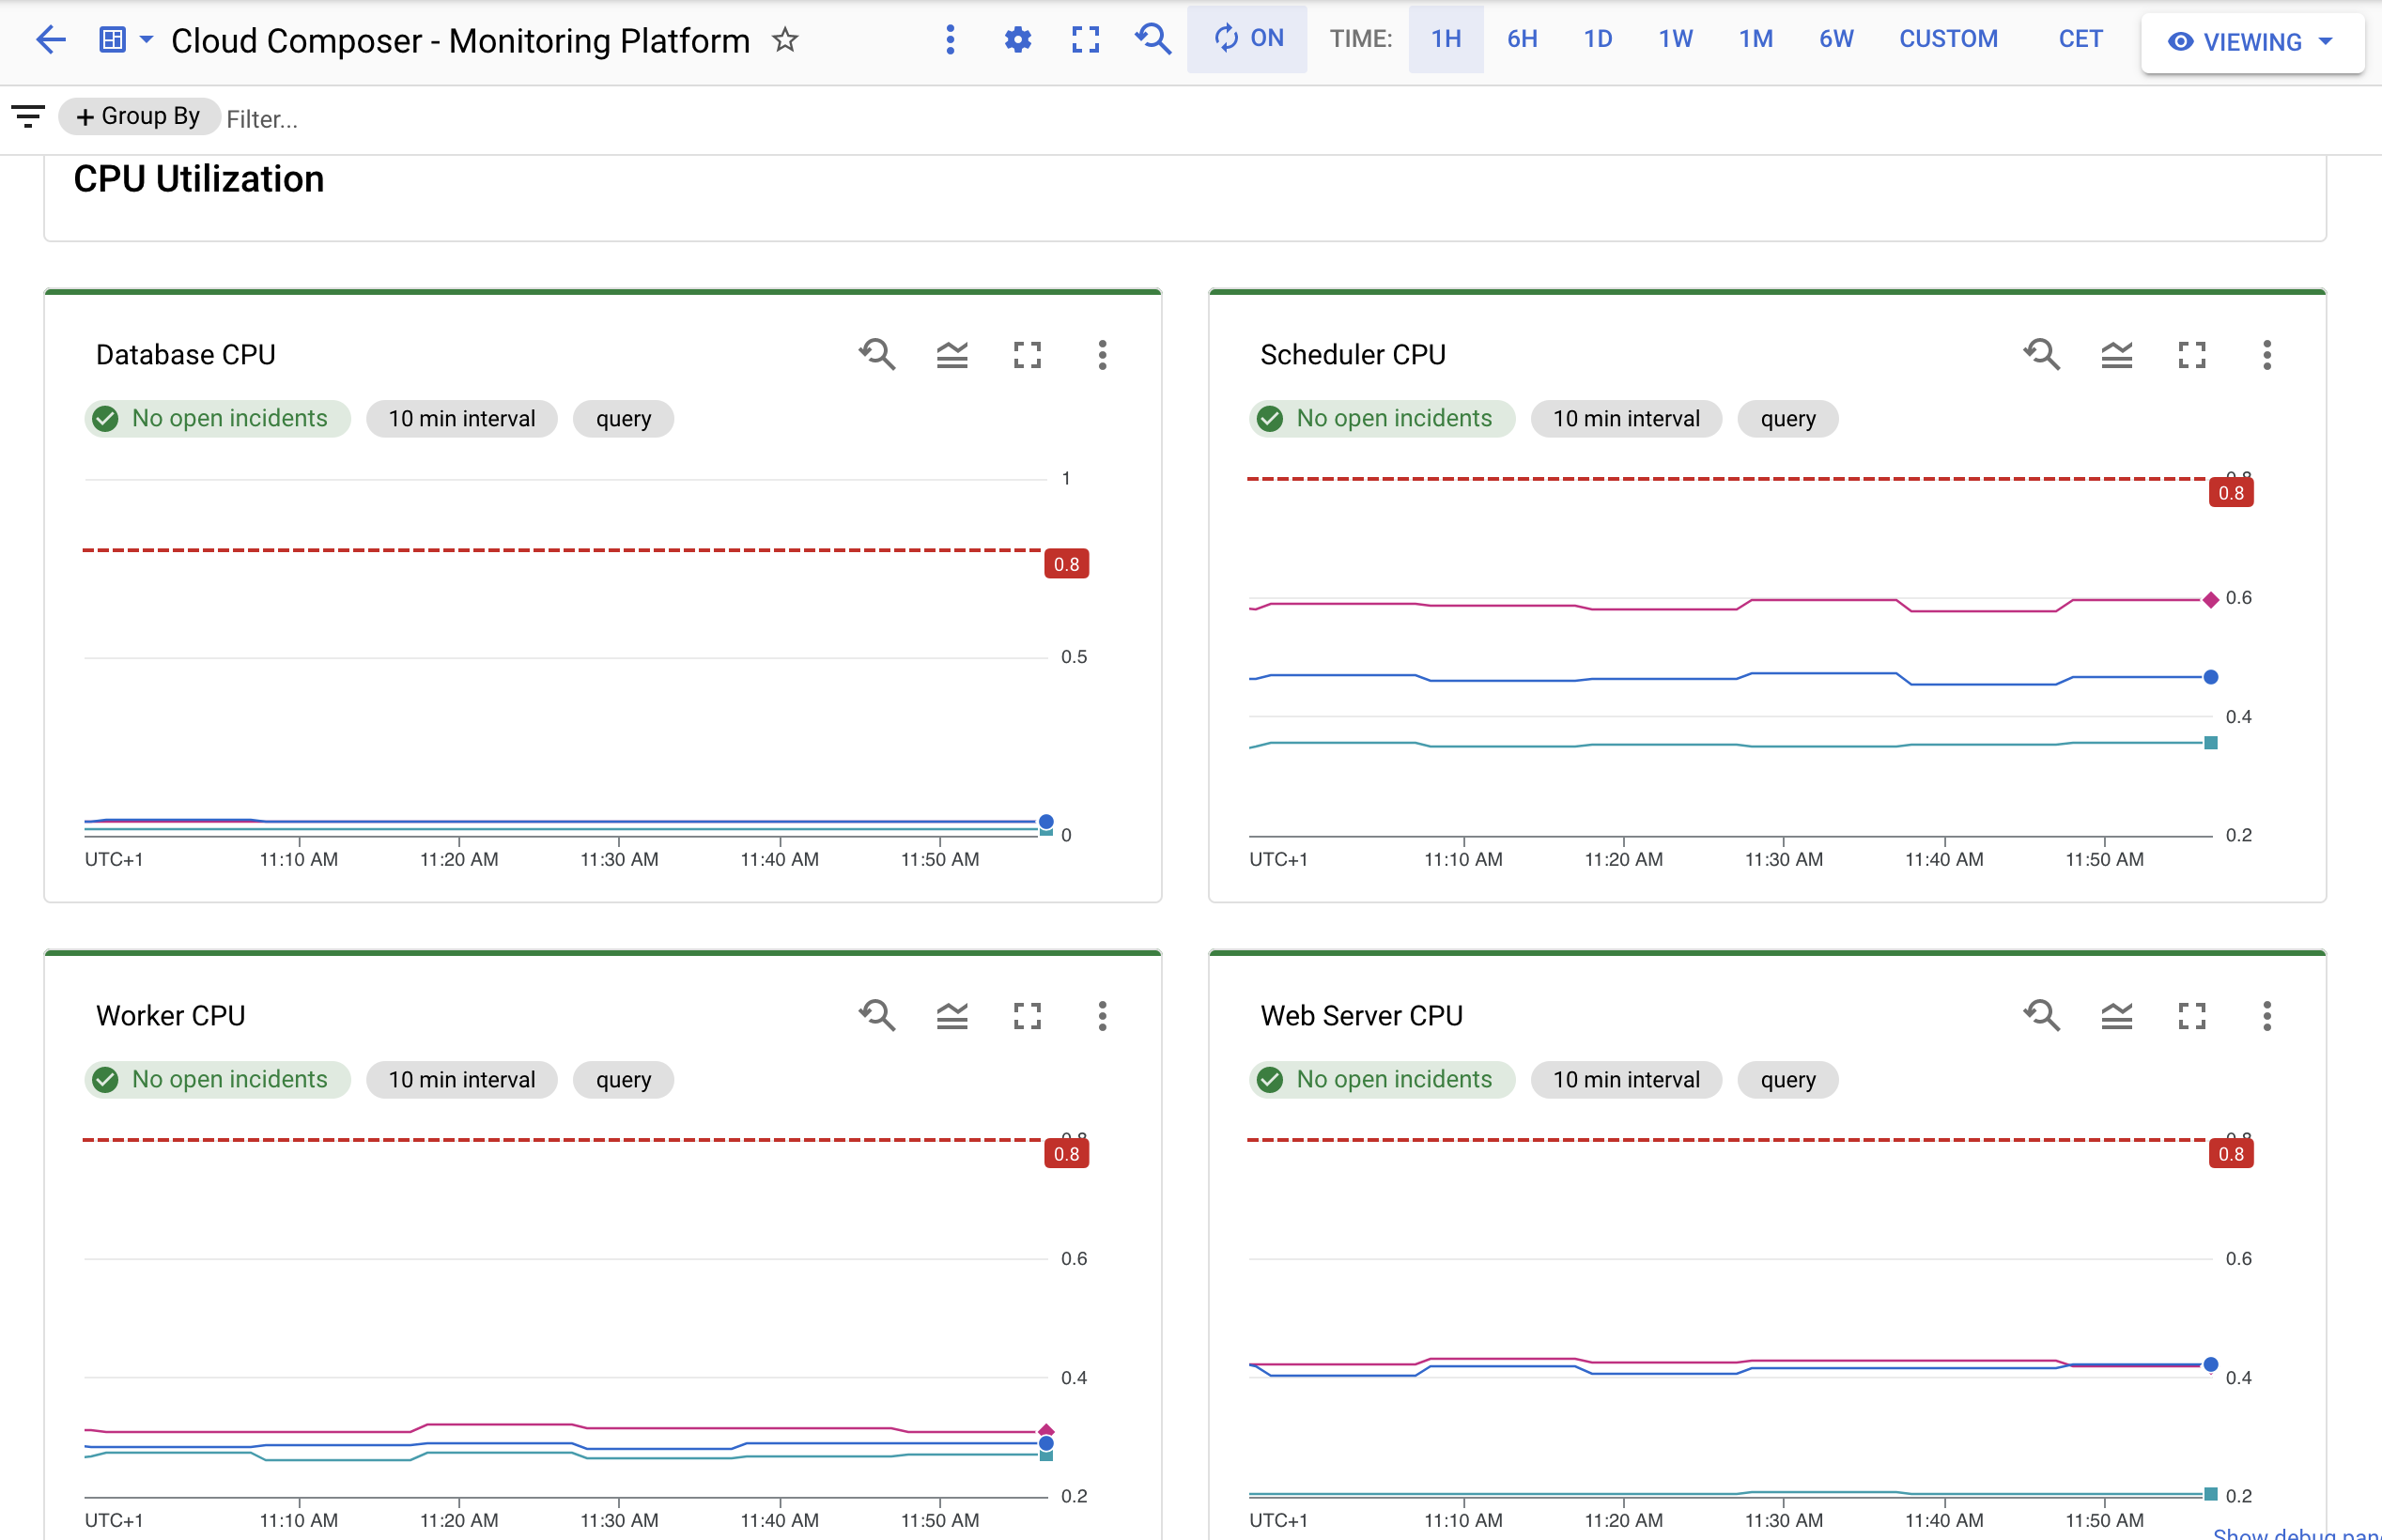
כדי לראות איזו סביבה הקו מייצג, מעבירים את הסמן מעל קו מסוים. במרכז הבקרה מוצגים שם הפרויקט והמשאב:
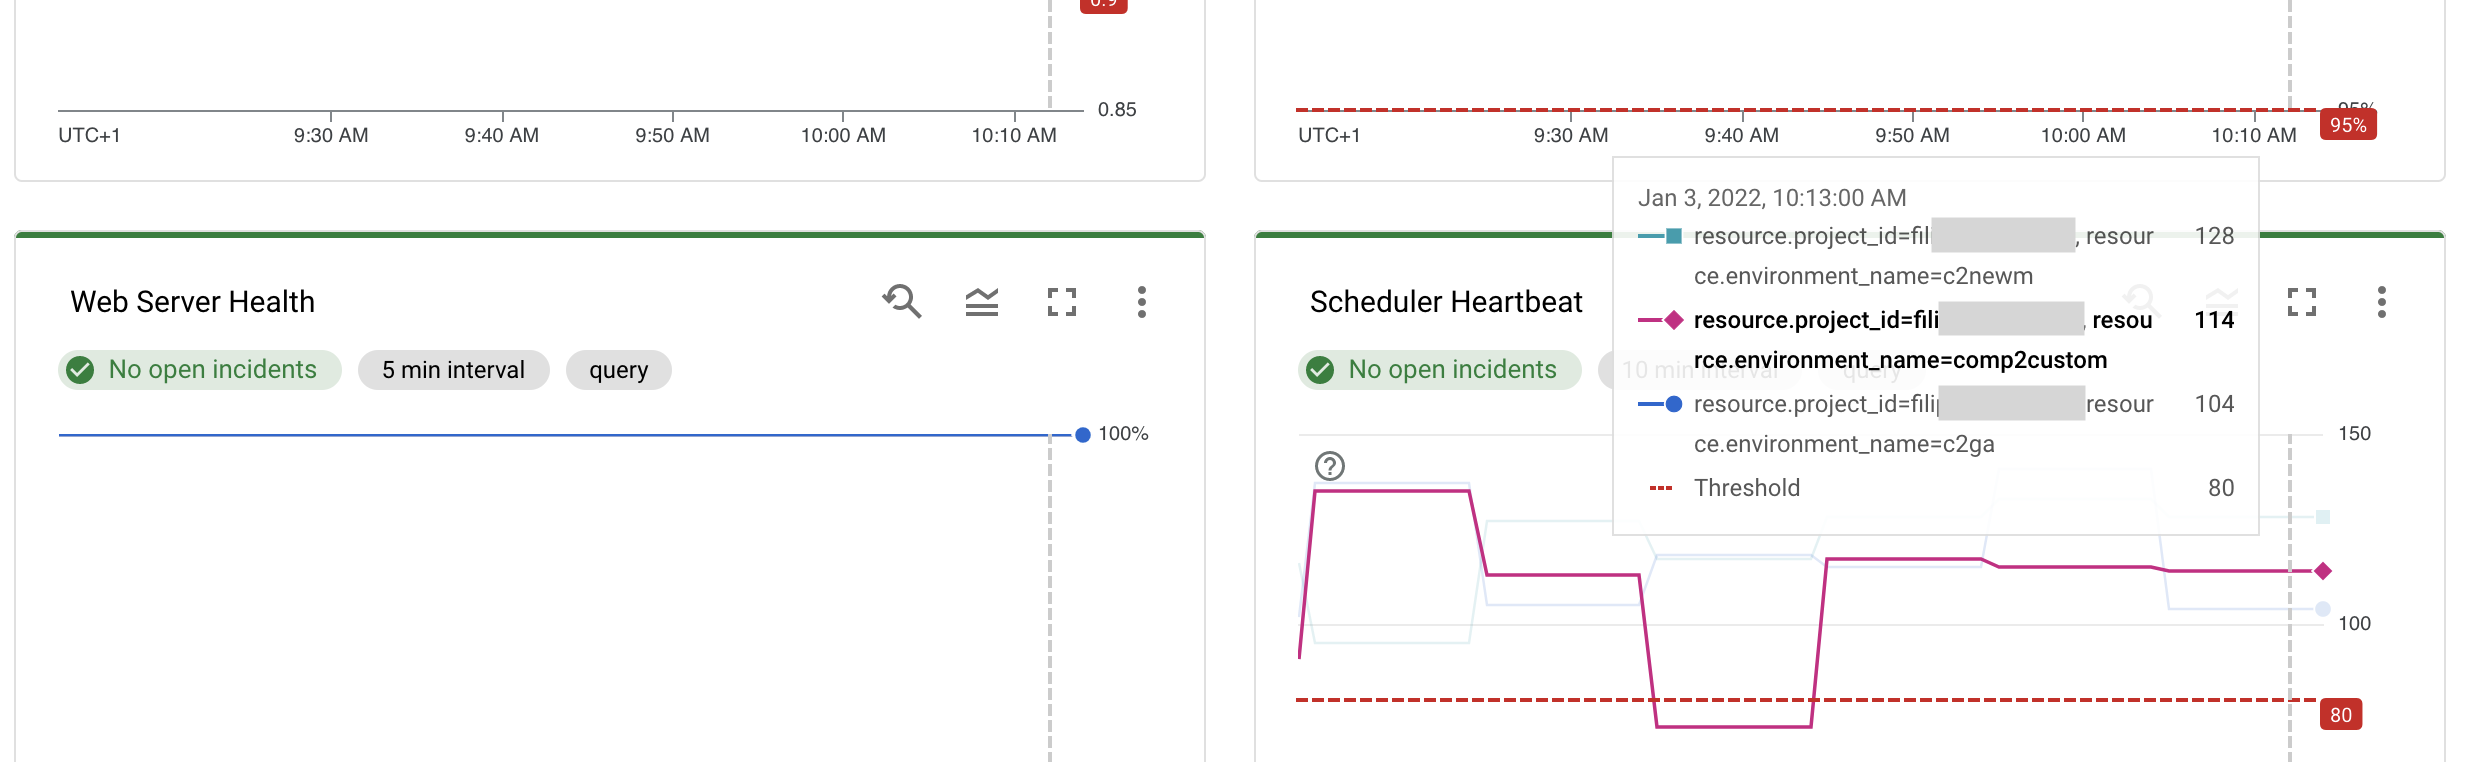
אם מדד מסוים חורג מסף שהוגדר מראש, נוצר אירוע ומוצגת התראה מתאימה בתרשים שמתאים למדד הזה:

רשימת המדדים שנבדקים
רשימה מלאה של מדדים שנבדקים:
- התקינות של סביבת Managed Airflow (על סמך Monitoring DAG)
- תקינות מסד הנתונים
- תקינות שרת האינטרנט
- החלקים החשובים בפורמט אנכי
- ניצול המעבד (CPU) והזיכרון של כל העובדים
- ניצול המעבד (CPU) והזיכרון במסד הנתונים של Airflow
- ניצול המעבד (CPU) והזיכרון של שרת האינטרנט
- ניצול המעבד (CPU) והזיכרון של מתזמני Airflow
- השיעור של משימות בתור, מתוזמנות, בתור או מתוזמנות בסביבה מסוימת (שימושי לזיהוי בעיות בהגדרת מקבילות ב-Airflow)
- זמן הניתוח של DAG
- מספר העובדים הנוכחי לעומת מספר העובדים המינימלי – נתון שימושי להבנת בעיות ביציבות של העובדים או בעיות בהתאמת הגודל
- הוצאה של Worker Pods
- מספר השגיאות שנוצרו ביומנים על ידי Workers, Schedulers, Web Server או רכיבים אחרים (תרשימים נפרדים)
לפני שמתחילים
כדי להשתמש ב-Managed Airflow וב-Cloud Monitoring, צריך ליצור Cloud de Confiance by S3NS פרויקט ולהפעיל את החיוב. הפרויקט חייב להכיל סביבת Airflow מנוהלת. במדריך הזה, הפרויקט הזה נקרא פרויקט המעקב.
-
In the Cloud de Confiance console, on the project selector page, select or create a Cloud de Confiance project.
Roles required to select or create a project
- Select a project: Selecting a project doesn't require a specific IAM role—you can select any project that you've been granted a role on.
-
Create a project: To create a project, you need the Project Creator role
(
roles/resourcemanager.projectCreator), which contains theresourcemanager.projects.createpermission. Learn how to grant roles.
-
Verify that billing is enabled for your Cloud de Confiance project.
- מתקינים את Terraform אם הוא עדיין לא מותקן.
- מגדירים את היקף המדדים בפרויקט. כברירת מחדל, בפרויקט אפשר רק להציג או לנטר נתונים של סדרות זמן שנשמרים בו. אם רוצים להציג נתונים או לעקוב אחרי נתונים שמאוחסנים בכמה פרויקטים, צריך להגדיר את היקף המדדים בפרויקט. מידע נוסף זמין במאמר סקירה כללית על היקפי מדדים.
שלבי ההטמעה
במחשב המקומי שבו מריצים את Terraform, מגדירים את משתנה הסביבה
GOOGLE_CLOUD_PROJECTלמזהה של פרויקט המעקב:export GOOGLE_CLOUD_PROJECT=MONITORING_PROJECT_IDמוודאים שספק Google של Terraform מאומת ויש לו גישה להרשאות הבאות:
- הרשאת
roles/monitoring.editorבפרויקט המעקב -
roles/monitoring.viewer,roles/logging.viewerבכל הפרויקטים שבמעקב
- הרשאת
מעתיקים את הקובץ
main.tfהבא למחשב המקומי שבו מריצים את Terraform.לחצו כדי להרחיב
# Monitoring for multiple Cloud Composer environments # # Usage: # 1. Create a new project that you will use for monitoring of Cloud Composer environments in other projects # 2. Replace YOUR_MONITORING_PROJECT with the name of this project in the "metrics_scope" parameter that is part of the "Add Monitored Projects to the Monitoring project" section # 3. Replace the list of projects to monitor with your list of projects with Cloud Composer environments to be monitored in the "for_each" parameter of the "Add Monitored Projects to the Monitoring project" section # 4. Set up your environment and apply the configuration following these steps: https://cloud.google.com/docs/terraform/basic-commands. Your GOOGLE_CLOUD_PROJECT environment variable should be the new monitoring project you just created. # # The script creates the following resources in the monitoring project: # 1. Adds monitored projects to Cloud Monitoring # 2. Creates Alert Policies # 3. Creates Monitoring Dashboard # ####################################################### # # Add Monitored Projects to the Monitoring project # ######################################################## resource "google_monitoring_monitored_project" "projects_monitored" { for_each = toset(["YOUR_PROJECT_TO_MONITOR_1", "YOUR_PROJECT_TO_MONITOR_2", "YOUR_PROJECT_TO_MONITOR_3"]) metrics_scope = join("", ["locations/global/metricsScopes/", "YOUR_MONITORING_PROJECT"]) name = each.value } ####################################################### # # Create alert policies in Monitoring project # ######################################################## resource "google_monitoring_alert_policy" "environment_health" { display_name = "Environment Health" combiner = "OR" conditions { display_name = "Environment Health" condition_monitoring_query_language { query = join("", [ "fetch cloud_composer_environment", "| {metric 'composer.googleapis.com/environment/dagbag_size'", "| group_by 5m, [value_dagbag_size_mean: if(mean(value.dagbag_size) > 0, 1, 0)]", "| align mean_aligner(5m)", "| group_by [resource.project_id, resource.environment_name], [value_dagbag_size_mean_aggregate: aggregate(value_dagbag_size_mean)]; ", "metric 'composer.googleapis.com/environment/healthy'", "| group_by 5m, [value_sum_signals: aggregate(if(value.healthy,1,0))]", "| align mean_aligner(5m)| absent_for 5m }", "| outer_join 0", "| group_by [resource.project_id, resource.environment_name]", "| value val(2)", "| align mean_aligner(5m)", "| window(5m)", "| condition val(0) < 0.9" ]) duration = "120s" trigger { count = "1" } } } # uncomment to set an auto close strategy for the alert #alert_strategy { # auto_close = "30m" #} } resource "google_monitoring_alert_policy" "database_health" { display_name = "Database Health" combiner = "OR" conditions { display_name = "Database Health" condition_monitoring_query_language { query = join("", [ "fetch cloud_composer_environment", "| metric 'composer.googleapis.com/environment/database_health'", "| group_by 5m,", " [value_database_health_fraction_true: fraction_true(value.database_health)]", "| every 5m", "| group_by 5m,", " [value_database_health_fraction_true_aggregate:", " aggregate(value_database_health_fraction_true)]", "| every 5m", "| group_by [resource.project_id, resource.environment_name],", " [value_database_health_fraction_true_aggregate_aggregate:", " aggregate(value_database_health_fraction_true_aggregate)]", "| condition val() < 0.95"]) duration = "120s" trigger { count = "1" } } } # uncomment to set an auto close strategy for the alert #alert_strategy { # auto_close = "30m" #} } resource "google_monitoring_alert_policy" "webserver_health" { display_name = "Web Server Health" combiner = "OR" conditions { display_name = "Web Server Health" condition_monitoring_query_language { query = join("", [ "fetch cloud_composer_environment", "| metric 'composer.googleapis.com/environment/web_server/health'", "| group_by 5m, [value_health_fraction_true: fraction_true(value.health)]", "| every 5m", "| group_by 5m,", " [value_health_fraction_true_aggregate:", " aggregate(value_health_fraction_true)]", "| every 5m", "| group_by [resource.project_id, resource.environment_name],", " [value_health_fraction_true_aggregate_aggregate:", " aggregate(value_health_fraction_true_aggregate)]", "| condition val() < 0.95"]) duration = "120s" trigger { count = "1" } } } # uncomment to set an auto close strategy for the alert #alert_strategy { # auto_close = "30m" #} } resource "google_monitoring_alert_policy" "scheduler_heartbeat" { display_name = "Scheduler Heartbeat" combiner = "OR" conditions { display_name = "Scheduler Heartbeat" condition_monitoring_query_language { query = join("", [ "fetch cloud_composer_environment", "| metric 'composer.googleapis.com/environment/scheduler_heartbeat_count'", "| group_by 10m,", " [value_scheduler_heartbeat_count_aggregate:", " aggregate(value.scheduler_heartbeat_count)]", "| every 10m", "| group_by 10m,", " [value_scheduler_heartbeat_count_aggregate_mean:", " mean(value_scheduler_heartbeat_count_aggregate)]", "| every 10m", "| group_by [resource.project_id, resource.environment_name],", " [value_scheduler_heartbeat_count_aggregate_mean_aggregate:", " aggregate(value_scheduler_heartbeat_count_aggregate_mean)]", "| condition val() < 80"]) duration = "120s" trigger { count = "1" } } } # uncomment to set an auto close strategy for the alert #alert_strategy { # auto_close = "30m" #} } resource "google_monitoring_alert_policy" "database_cpu" { display_name = "Database CPU" combiner = "OR" conditions { display_name = "Database CPU" condition_monitoring_query_language { query = join("", [ "fetch cloud_composer_environment", "| metric 'composer.googleapis.com/environment/database/cpu/utilization'", "| group_by 10m, [value_utilization_mean: mean(value.utilization)]", "| every 10m", "| group_by [resource.project_id, resource.environment_name]", "| condition val() > 0.8"]) duration = "120s" trigger { count = "1" } } } # uncomment to set an auto close strategy for the alert #alert_strategy { # auto_close = "30m" #} } resource "google_monitoring_alert_policy" "scheduler_cpu" { display_name = "Scheduler CPU" combiner = "OR" conditions { display_name = "Scheduler CPU" condition_monitoring_query_language { query = join("", [ "fetch k8s_container", "| metric 'kubernetes.io/container/cpu/limit_utilization'", "| filter (resource.pod_name =~ 'airflow-scheduler-.*')", "| group_by 10m, [value_limit_utilization_mean: mean(value.limit_utilization)]", "| every 10m", "| group_by [resource.cluster_name],", " [value_limit_utilization_mean_mean: mean(value_limit_utilization_mean)]", "| condition val() > 0.8"]) duration = "120s" trigger { count = "1" } } } # uncomment to set an auto close strategy for the alert #alert_strategy { # auto_close = "30m" #} } resource "google_monitoring_alert_policy" "worker_cpu" { display_name = "Worker CPU" combiner = "OR" conditions { display_name = "Worker CPU" condition_monitoring_query_language { query = join("", [ "fetch k8s_container", "| metric 'kubernetes.io/container/cpu/limit_utilization'", "| filter (resource.pod_name =~ 'airflow-worker.*')", "| group_by 10m, [value_limit_utilization_mean: mean(value.limit_utilization)]", "| every 10m", "| group_by [resource.cluster_name],", " [value_limit_utilization_mean_mean: mean(value_limit_utilization_mean)]", "| condition val() > 0.8"]) duration = "120s" trigger { count = "1" } } } # uncomment to set an auto close strategy for the alert #alert_strategy { # auto_close = "30m" #} } resource "google_monitoring_alert_policy" "webserver_cpu" { display_name = "Web Server CPU" combiner = "OR" conditions { display_name = "Web Server CPU" condition_monitoring_query_language { query = join("", [ "fetch k8s_container", "| metric 'kubernetes.io/container/cpu/limit_utilization'", "| filter (resource.pod_name =~ 'airflow-webserver.*')", "| group_by 10m, [value_limit_utilization_mean: mean(value.limit_utilization)]", "| every 10m", "| group_by [resource.cluster_name],", " [value_limit_utilization_mean_mean: mean(value_limit_utilization_mean)]", "| condition val() > 0.8"]) duration = "120s" trigger { count = "1" } } } # uncomment to set an auto close strategy for the alert #alert_strategy { # auto_close = "30m" #} } resource "google_monitoring_alert_policy" "parsing_time" { display_name = "DAG Parsing Time" combiner = "OR" conditions { display_name = "DAG Parsing Time" condition_monitoring_query_language { query = join("", [ "fetch cloud_composer_environment", "| metric 'composer.googleapis.com/environment/dag_processing/total_parse_time'", "| group_by 5m, [value_total_parse_time_mean: mean(value.total_parse_time)]", "| every 5m", "| group_by [resource.project_id, resource.environment_name]", "| condition val(0) > cast_units(30,\"s\")"]) duration = "120s" trigger { count = "1" } } } # uncomment to set an auto close strategy for the alert #alert_strategy { # auto_close = "30m" #} } resource "google_monitoring_alert_policy" "database_memory" { display_name = "Database Memory" combiner = "OR" conditions { display_name = "Database Memory" condition_monitoring_query_language { query = join("", [ "fetch cloud_composer_environment", "| metric 'composer.googleapis.com/environment/database/memory/utilization'", "| group_by 10m, [value_utilization_mean: mean(value.utilization)]", "| every 10m", "| group_by [resource.project_id, resource.environment_name]", "| condition val() > 0.8"]) duration = "0s" trigger { count = "1" } } } # uncomment to set an auto close strategy for the alert #alert_strategy { # auto_close = "30m" #} } resource "google_monitoring_alert_policy" "scheduler_memory" { display_name = "Scheduler Memory" combiner = "OR" conditions { display_name = "Scheduler Memory" condition_monitoring_query_language { query = join("", [ "fetch k8s_container", "| metric 'kubernetes.io/container/memory/limit_utilization'", "| filter (resource.pod_name =~ 'airflow-scheduler-.*')", "| group_by 10m, [value_limit_utilization_mean: mean(value.limit_utilization)]", "| every 10m", "| group_by [resource.cluster_name],", " [value_limit_utilization_mean_mean: mean(value_limit_utilization_mean)]", "| condition val() > 0.8"]) duration = "0s" trigger { count = "1" } } } documentation { content = join("", [ "Scheduler Memory exceeds a threshold, summed across all schedulers in the environment. ", "Add more schedulers OR increase scheduler's memory OR reduce scheduling load (e.g. through lower parsing frequency or lower number of DAGs/tasks running"]) } # uncomment to set an auto close strategy for the alert #alert_strategy { # auto_close = "30m" #} } resource "google_monitoring_alert_policy" "worker_memory" { display_name = "Worker Memory" combiner = "OR" conditions { display_name = "Worker Memory" condition_monitoring_query_language { query = join("", [ "fetch k8s_container", "| metric 'kubernetes.io/container/memory/limit_utilization'", "| filter (resource.pod_name =~ 'airflow-worker.*')", "| group_by 10m, [value_limit_utilization_mean: mean(value.limit_utilization)]", "| every 10m", "| group_by [resource.cluster_name],", " [value_limit_utilization_mean_mean: mean(value_limit_utilization_mean)]", "| condition val() > 0.8"]) duration = "0s" trigger { count = "1" } } } # uncomment to set an auto close strategy for the alert #alert_strategy { # auto_close = "30m" #} } resource "google_monitoring_alert_policy" "webserver_memory" { display_name = "Web Server Memory" combiner = "OR" conditions { display_name = "Web Server Memory" condition_monitoring_query_language { query = join("", [ "fetch k8s_container", "| metric 'kubernetes.io/container/memory/limit_utilization'", "| filter (resource.pod_name =~ 'airflow-webserver.*')", "| group_by 10m, [value_limit_utilization_mean: mean(value.limit_utilization)]", "| every 10m", "| group_by [resource.cluster_name],", " [value_limit_utilization_mean_mean: mean(value_limit_utilization_mean)]", "| condition val() > 0.8"]) duration = "0s" trigger { count = "1" } } } # uncomment to set an auto close strategy for the alert #alert_strategy { # auto_close = "30m" #} } resource "google_monitoring_alert_policy" "scheduled_tasks_percentage" { display_name = "Scheduled Tasks Percentage" combiner = "OR" conditions { display_name = "Scheduled Tasks Percentage" condition_monitoring_query_language { query = join("", [ "fetch cloud_composer_environment", "| metric 'composer.googleapis.com/environment/unfinished_task_instances'", "| align mean_aligner(10m)", "| every(10m)", "| window(10m)", "| filter_ratio_by [resource.project_id, resource.environment_name], metric.state = 'scheduled'", "| condition val() > 0.80"]) duration = "300s" trigger { count = "1" } } } # uncomment to set an auto close strategy for the alert #alert_strategy { # auto_close = "30m" #} } resource "google_monitoring_alert_policy" "queued_tasks_percentage" { display_name = "Queued Tasks Percentage" combiner = "OR" conditions { display_name = "Queued Tasks Percentage" condition_monitoring_query_language { query = join("", [ "fetch cloud_composer_environment", "| metric 'composer.googleapis.com/environment/unfinished_task_instances'", "| align mean_aligner(10m)", "| every(10m)", "| window(10m)", "| filter_ratio_by [resource.project_id, resource.environment_name], metric.state = 'queued'", "| group_by [resource.project_id, resource.environment_name]", "| condition val() > 0.95"]) duration = "300s" trigger { count = "1" } } } # uncomment to set an auto close strategy for the alert #alert_strategy { # auto_close = "30m" #} } resource "google_monitoring_alert_policy" "queued_or_scheduled_tasks_percentage" { display_name = "Queued or Scheduled Tasks Percentage" combiner = "OR" conditions { display_name = "Queued or Scheduled Tasks Percentage" condition_monitoring_query_language { query = join("", [ "fetch cloud_composer_environment", "| metric 'composer.googleapis.com/environment/unfinished_task_instances'", "| align mean_aligner(10m)", "| every(10m)", "| window(10m)", "| filter_ratio_by [resource.project_id, resource.environment_name], or(metric.state = 'queued', metric.state = 'scheduled' )", "| group_by [resource.project_id, resource.environment_name]", "| condition val() > 0.80"]) duration = "120s" trigger { count = "1" } } } # uncomment to set an auto close strategy for the alert #alert_strategy { # auto_close = "30m" #} } resource "google_monitoring_alert_policy" "workers_above_minimum" { display_name = "Workers above minimum (negative = missing workers)" combiner = "OR" conditions { display_name = "Workers above minimum" condition_monitoring_query_language { query = join("", [ "fetch cloud_composer_environment", "| { metric 'composer.googleapis.com/environment/num_celery_workers'", "| group_by 5m, [value_num_celery_workers_mean: mean(value.num_celery_workers)]", "| every 5m", "; metric 'composer.googleapis.com/environment/worker/min_workers'", "| group_by 5m, [value_min_workers_mean: mean(value.min_workers)]", "| every 5m }", "| outer_join 0", "| sub", "| group_by [resource.project_id, resource.environment_name]", "| condition val() < 0"]) duration = "0s" trigger { count = "1" } } } # uncomment to set an auto close strategy for the alert #alert_strategy { # auto_close = "30m" #} } resource "google_monitoring_alert_policy" "pod_evictions" { display_name = "Worker pod evictions" combiner = "OR" conditions { display_name = "Worker pod evictions" condition_monitoring_query_language { query = join("", [ "fetch cloud_composer_environment", "| metric 'composer.googleapis.com/environment/worker/pod_eviction_count'", "| align delta(1m)", "| every 1m", "| group_by [resource.project_id, resource.environment_name]", "| condition val() > 0"]) duration = "60s" trigger { count = "1" } } } # uncomment to set an auto close strategy for the alert #alert_strategy { # auto_close = "30m" #} } resource "google_monitoring_alert_policy" "scheduler_errors" { display_name = "Scheduler Errors" combiner = "OR" conditions { display_name = "Scheduler Errors" condition_monitoring_query_language { query = join("", [ "fetch cloud_composer_environment", "| metric 'logging.googleapis.com/log_entry_count'", "| filter (metric.log == 'airflow-scheduler' && metric.severity == 'ERROR')", "| group_by 5m,", " [value_log_entry_count_aggregate: aggregate(value.log_entry_count)]", "| every 5m", "| group_by [resource.project_id, resource.environment_name],", " [value_log_entry_count_aggregate_max: max(value_log_entry_count_aggregate)]", "| condition val() > 50"]) duration = "300s" trigger { count = "1" } } } # uncomment to set an auto close strategy for the alert #alert_strategy { # auto_close = "30m" #} } resource "google_monitoring_alert_policy" "worker_errors" { display_name = "Worker Errors" combiner = "OR" conditions { display_name = "Worker Errors" condition_monitoring_query_language { query = join("", [ "fetch cloud_composer_environment", "| metric 'logging.googleapis.com/log_entry_count'", "| filter (metric.log == 'airflow-worker' && metric.severity == 'ERROR')", "| group_by 5m,", " [value_log_entry_count_aggregate: aggregate(value.log_entry_count)]", "| every 5m", "| group_by [resource.project_id, resource.environment_name],", " [value_log_entry_count_aggregate_max: max(value_log_entry_count_aggregate)]", "| condition val() > 50"]) duration = "300s" trigger { count = "1" } } } # uncomment to set an auto close strategy for the alert #alert_strategy { # auto_close = "30m" #} } resource "google_monitoring_alert_policy" "webserver_errors" { display_name = "Web Server Errors" combiner = "OR" conditions { display_name = "Web Server Errors" condition_monitoring_query_language { query = join("", [ "fetch cloud_composer_environment", "| metric 'logging.googleapis.com/log_entry_count'", "| filter (metric.log == 'airflow-webserver' && metric.severity == 'ERROR')", "| group_by 5m,", " [value_log_entry_count_aggregate: aggregate(value.log_entry_count)]", "| every 5m", "| group_by [resource.project_id, resource.environment_name],", " [value_log_entry_count_aggregate_max: max(value_log_entry_count_aggregate)]", "| condition val() > 50"]) duration = "300s" trigger { count = "1" } } } # uncomment to set an auto close strategy for the alert #alert_strategy { # auto_close = "30m" #} } resource "google_monitoring_alert_policy" "other_errors" { display_name = "Other Errors" combiner = "OR" conditions { display_name = "Other Errors" condition_monitoring_query_language { query = join("", [ "fetch cloud_composer_environment", "| metric 'logging.googleapis.com/log_entry_count'", "| filter", " (metric.log !~ 'airflow-scheduler|airflow-worker|airflow-webserver'", " && metric.severity == 'ERROR')", "| group_by 5m, [value_log_entry_count_max: max(value.log_entry_count)]", "| every 5m", "| group_by [resource.project_id, resource.environment_name],", " [value_log_entry_count_max_aggregate: aggregate(value_log_entry_count_max)]", "| condition val() > 10"]) duration = "300s" trigger { count = "1" } } } # uncomment to set an auto close strategy for the alert #alert_strategy { # auto_close = "30m" #} } ####################################################### # # Create Monitoring Dashboard # ######################################################## resource "google_monitoring_dashboard" "Composer_Dashboard" { dashboard_json = <<EOF { "category": "CUSTOM", "displayName": "Cloud Composer - Monitoring Platform", "mosaicLayout": { "columns": 12, "tiles": [ { "height": 1, "widget": { "text": { "content": "", "format": "MARKDOWN" }, "title": "Health" }, "width": 12, "xPos": 0, "yPos": 0 }, { "height": 4, "widget": { "alertChart": { "name": "${google_monitoring_alert_policy.environment_health.name}" } }, "width": 6, "xPos": 0, "yPos": 1 }, { "height": 4, "widget": { "alertChart": { "name": "${google_monitoring_alert_policy.database_health.name}" } }, "width": 6, "xPos": 6, "yPos": 1 }, { "height": 4, "widget": { "alertChart": { "name": "${google_monitoring_alert_policy.webserver_health.name}" } }, "width": 6, "xPos": 0, "yPos": 5 }, { "height": 4, "widget": { "alertChart": { "name": "${google_monitoring_alert_policy.scheduler_heartbeat.name}" } }, "width": 6, "xPos": 6, "yPos": 5 }, { "height": 1, "widget": { "text": { "content": "", "format": "RAW" }, "title": "Airflow Task Execution and DAG Parsing" }, "width": 12, "xPos": 0, "yPos": 9 }, { "height": 4, "widget": { "alertChart": { "name": "${google_monitoring_alert_policy.scheduled_tasks_percentage.name}" } }, "width": 6, "xPos": 0, "yPos": 10 }, { "height": 4, "widget": { "alertChart": { "name": "${google_monitoring_alert_policy.queued_tasks_percentage.name}" } }, "width": 6, "xPos": 6, "yPos": 10 }, { "height": 4, "widget": { "alertChart": { "name": "${google_monitoring_alert_policy.queued_or_scheduled_tasks_percentage.name}" } }, "width": 6, "xPos": 0, "yPos": 14 }, { "height": 4, "widget": { "alertChart": { "name": "${google_monitoring_alert_policy.parsing_time.name}" } }, "width": 6, "xPos": 6, "yPos": 14 }, { "height": 1, "widget": { "text": { "content": "", "format": "RAW" }, "title": "Workers presence" }, "width": 12, "xPos": 0, "yPos": 18 }, { "height": 4, "widget": { "alertChart": { "name": "${google_monitoring_alert_policy.workers_above_minimum.name}" } }, "width": 6, "xPos": 0, "yPos": 19 }, { "height": 4, "widget": { "alertChart": { "name": "${google_monitoring_alert_policy.pod_evictions.name}" } }, "width": 6, "xPos": 6, "yPos": 19 }, { "height": 1, "widget": { "text": { "content": "", "format": "RAW" }, "title": "CPU Utilization" }, "width": 12, "xPos": 0, "yPos": 23 }, { "height": 4, "widget": { "alertChart": { "name": "${google_monitoring_alert_policy.database_cpu.name}" } }, "width": 6, "xPos": 0, "yPos": 24 }, { "height": 4, "widget": { "alertChart": { "name": "${google_monitoring_alert_policy.scheduler_cpu.name}" } }, "width": 6, "xPos": 6, "yPos": 24 }, { "height": 4, "widget": { "alertChart": { "name": "${google_monitoring_alert_policy.worker_cpu.name}" } }, "width": 6, "xPos": 0, "yPos": 28 }, { "height": 4, "widget": { "alertChart": { "name": "${google_monitoring_alert_policy.webserver_cpu.name}" } }, "width": 6, "xPos": 6, "yPos": 28 }, { "height": 1, "widget": { "text": { "content": "", "format": "RAW" }, "title": "Memory Utilization" }, "width": 12, "xPos": 0, "yPos": 32 }, { "height": 4, "widget": { "alertChart": { "name": "${google_monitoring_alert_policy.database_memory.name}" } }, "width": 6, "xPos": 0, "yPos": 33 }, { "height": 4, "widget": { "alertChart": { "name": "${google_monitoring_alert_policy.scheduler_memory.name}" } }, "width": 6, "xPos": 6, "yPos": 33 }, { "height": 4, "widget": { "alertChart": { "name": "${google_monitoring_alert_policy.worker_memory.name}" } }, "width": 6, "xPos": 0, "yPos": 37 }, { "height": 4, "widget": { "alertChart": { "name": "${google_monitoring_alert_policy.webserver_memory.name}" } }, "width": 6, "xPos": 6, "yPos": 37 }, { "height": 1, "widget": { "text": { "content": "", "format": "RAW" }, "title": "Airflow component errors" }, "width": 12, "xPos": 0, "yPos": 41 }, { "height": 4, "widget": { "alertChart": { "name": "${google_monitoring_alert_policy.scheduler_errors.name}" } }, "width": 6, "xPos": 0, "yPos": 42 }, { "height": 4, "widget": { "alertChart": { "name": "${google_monitoring_alert_policy.worker_errors.name}" } }, "width": 6, "xPos": 6, "yPos": 42 }, { "height": 4, "widget": { "alertChart": { "name": "${google_monitoring_alert_policy.webserver_errors.name}" } }, "width": 6, "xPos": 0, "yPos": 48 }, { "height": 4, "widget": { "alertChart": { "name": "${google_monitoring_alert_policy.other_errors.name}" } }, "width": 6, "xPos": 6, "yPos": 48 }, { "height": 1, "widget": { "text": { "content": "", "format": "RAW" }, "title": "Task errors" }, "width": 12, "xPos": 0, "yPos": 52 } ] } } EOF }עורכים את הבלוק
"google_monitoring_monitored_project"resource:- מחליפים את רשימת הפרויקטים בבלוק
for_eachבפרויקטים שבמעקב. - מחליפים את
"YOUR_MONITORING_PROJECT"ב-metrics_scopeבשם של פרויקט המעקב.
- מחליפים את רשימת הפרויקטים בבלוק
בודקים את ההגדרות ומוודאים שהמשאבים שמערכת Terraform תיצור או תעדכן תואמים לציפיות שלכם. מבצעים תיקונים לפי הצורך.
terraform planמריצים את הפקודה הבאה ומזינים yes בהודעה שמופיעה, כדי להחיל את הגדרות Terraform:
terraform applyבמסוף Cloud de Confiance של פרויקט ה-Monitoring, עוברים לדף Monitoring Dashboard:
מעבר אל לוח הבקרה של Monitoring
בכרטיסייה Custom, מוצאים את לוח הבקרה המותאם אישית שנקרא Cloud Composer - Monitoring Platform.