グラフを使ってチャットする
会話型分析を使用して、グラフに関する質問をすることができます。エージェントは SQL クエリを作成し、出力の可視化を提供できます。エージェントは、グラフで定義された説明、類義語、指標を使用して、結果の品質を向上させることもできます。Enterprise または Enterprise Plus エディションをご利用の場合、エージェントはグラフに対して GQL クエリを実行できます。オンデマンド料金を使用する場合、エージェントは GRAPH_EXPAND 関数を呼び出してグラフで SQL クエリを実行できます。
グラフはテーブル間の関係をエンコードします。グラフをエージェントに提供すると、テーブル間の関係についての曖昧さが解消されます。これにより、ハルシネーションが減少し、会話の効率が向上します。
たとえば、一般公開されている Look Ecommerce グラフについてエージェントに質問するには、次の操作を行います。
Cloud de Confiance コンソールで、BigQuery の [エージェント] ページに移動します。
[エージェント カタログ] タブを選択します。
[Google のサンプル エージェント] セクションで、[The Look Graph] をクリックします。
会話が開きます。
bigquery-public-data.thelook_ecommerce.graphグラフに関する質問を入力できます。
制限事項
- エージェントまたは会話ごとに、データソースとして使用できるグラフは 1 つだけです。
- テーブルとグラフをデータソースとして組み合わせることはできません。
グラフを使ってチャットする
グラフとチャットするには、グラフをデータソースとしてデータ エージェントを作成するか、グラフとの直接会話を作成します。質問する内容がわからない場合は、What questions can I ask about this data? を試してください。たとえば、Look Ecommerce グラフについてこの質問をすると、グラフ スキーマの概要とおすすめの質問が返されます。レスポンスには次の質問が表示されることがあります。
業績
What is the total revenue for each product category, sorted from highest to lowest?What are the top 5 brands by total revenue among users from 'Brasil'?Rank the product categories based on their total revenue for each product department (Men/Women).
ユーザーと物流に関する分析情報
How many users do we have in each country?What is the distribution of user ages in the United States?Which distribution centers handle the most orders with a 'Complete' status?
関係分析
Show the connection between users and the distribution centers their products are shipped from.Find all products that have been ordered by users who came from a 'Search' traffic source.
グラフクエリと可視化を作成する
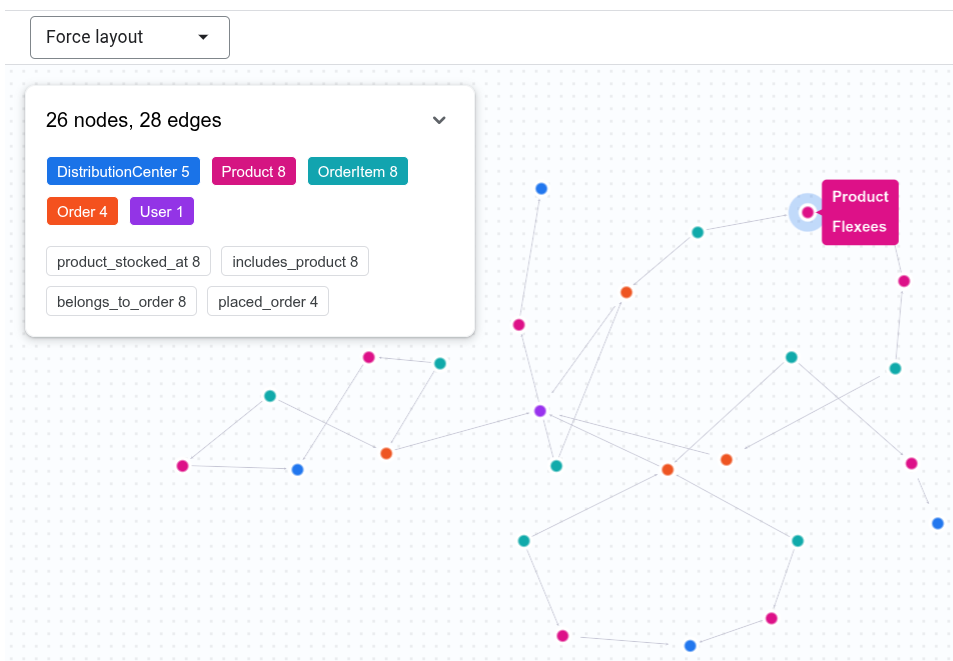
会話分析では、グラフに関する質問に答えるために GQL クエリを作成し、出力を可視化して表示できます。たとえば、チャットに「Show the connection between Tina Fletcher's orders and distribution centers」と入力します。エージェントは、次のような GQL クエリを実行する可能性があります。
GRAPH `bigquery-public-data.thelook_ecommerce.graph`
MATCH p = (u:User {id: 32})
          <-[:placed_order]-(o:`Order`)
          <-[:belongs_to_order]-(oi:OrderItem)
          -[:includes_product]->(pr:Product)
          -[:product_stocked_at]->(dc:DistributionCenter)
RETURN TO_JSON(p) AS path;
エージェントがインタラクティブな可視化を提供することもあります。
グラフの指標を使用する
会話分析では、グラフで定義された指標を使用して、集計を含む質問に正確に回答できます。たとえば、Look Graph エージェントに次の質問をします。
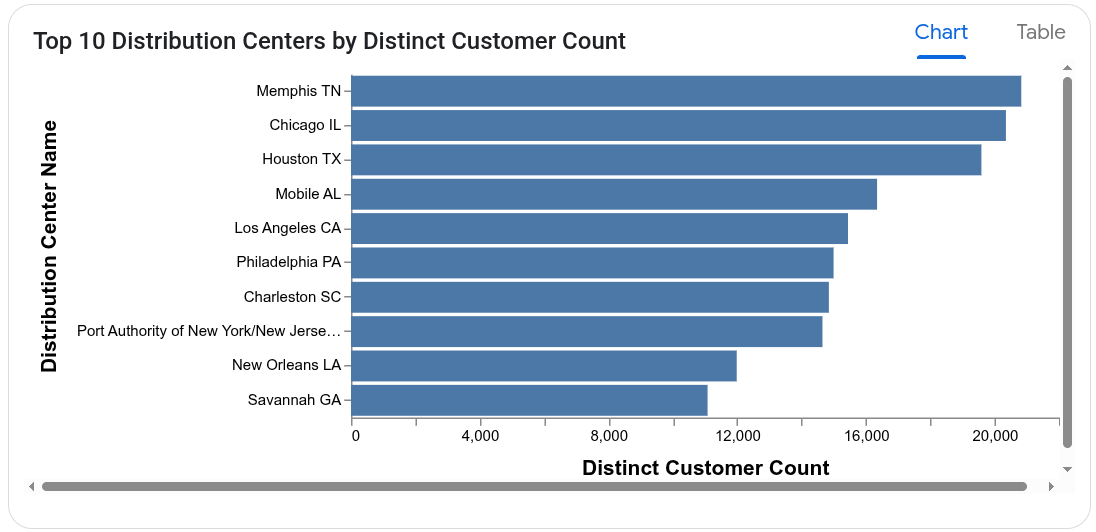
Which distribution centers process orders from the largest number of distinct customers?
エージェントは User ノードの user_count 指標を使用して、顧客数の過剰なカウントを回避します。レスポンスの計算に使用するクエリは、次のようになります。
SELECT
  DistributionCenter_id,
  DistributionCenter_name,
  AGG(User_user_count) AS distinct_customer_count
FROM
  GRAPH_EXPAND("bigquery-public-data.thelook_ecommerce.graph")
GROUP BY
  DistributionCenter_id,
  DistributionCenter_name
ORDER BY
  distinct_customer_count DESC;
エージェントは、グラフの可視化を提供することもあります。