
与图表 Chat
您可以使用对话式分析功能来询问有关图表的问题。智能体可以编写 SQL 查询,并提供输出的可视化图表。智能体还可以使用图表中定义的说明、同义词和指标来提高结果质量。如果您使用的是企业版或企业 Plus 版,则智能体可以在您的图上运行 GQL 查询。如果您使用按需价格,代理可以调用 GRAPH_EXPAND 函数在图上运行 SQL 查询。
图表可显示表之间的关系。向代理提供图表可消除有关表之间关系的歧义。这种清晰度可减少幻觉,并提高对话效率。
例如,如需尝试向代理询问公开提供的 Look Ecommerce 图,请执行以下操作:
在 Cloud de Confiance 控制台中,前往 BigQuery 代理页面。
选择智能体目录标签页。
在 Google 提供的示例代理部分中,点击外观图。
系统会打开一个对话。您可以输入有关
bigquery-public-data.thelook_ecommerce.graph图表的问题。
限制
- 每个代理或对话最多只能使用一个图表作为数据源。
- 您无法将表格和图表作为数据源进行组合。
与图表 Chat
如需与图进行对话,您可以创建以图为数据源的数据代理,也可以创建与图的直接对话。如果您不确定要问什么,可以尝试问What questions can I ask about this data? 例如,如果您就“Look 电子商务”图表提出此问题,回答中会包含图表架构的概览和建议的问题。回答中可能会出现以下问题:
业务表现
What is the total revenue for each product category, sorted from highest to lowest?What are the top 5 brands by total revenue among users from 'Brasil'?Rank the product categories based on their total revenue for each product department (Men/Women).
用户和物流数据分析
How many users do we have in each country?What is the distribution of user ages in the United States?Which distribution centers handle the most orders with a 'Complete' status?
关系分析
Show the connection between users and the distribution centers their products are shipped from.Find all products that have been ordered by users who came from a 'Search' traffic source.
创建图查询和可视化图表
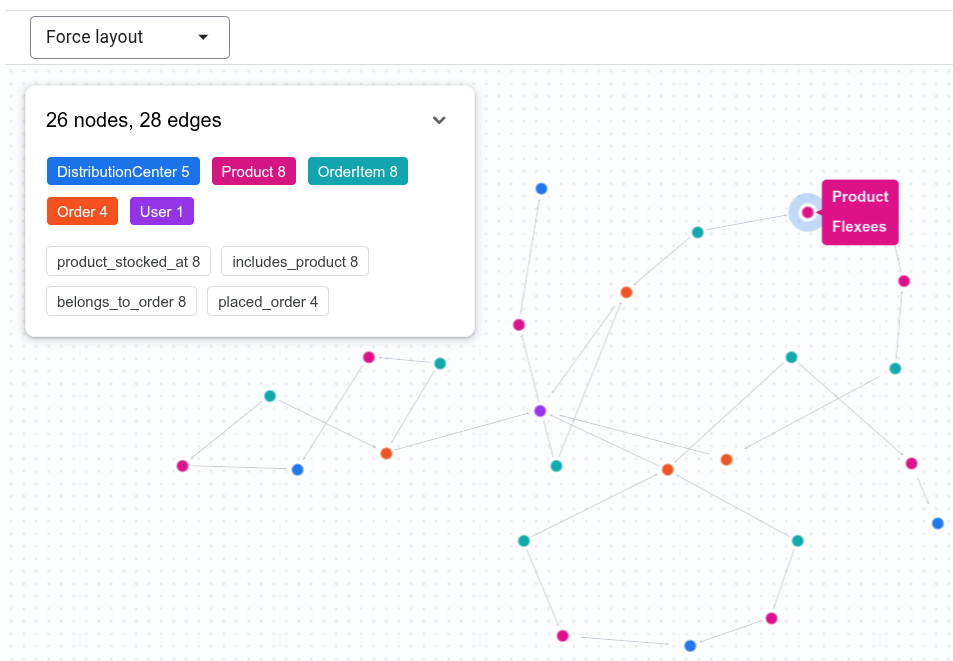
对话式分析可以编写 GQL 查询来回答有关图的问题,并以可视化图表的形式显示输出。例如,您可以在聊天中输入 Show the connection between Tina Fletcher's orders and distribution centers。智能体可能会运行类似于以下内容的 GQL 查询:
GRAPH `bigquery-public-data.thelook_ecommerce.graph`
MATCH p = (u:User {id: 32})
          <-[:placed_order]-(o:`Order`)
          <-[:belongs_to_order]-(oi:OrderItem)
          -[:includes_product]->(pr:Product)
          -[:product_stocked_at]->(dc:DistributionCenter)
RETURN TO_JSON(p) AS path;
智能体还可能会提供交互式可视化图表。
使用图表衡量指标
对话式分析功能可以使用图表中定义的度量,帮助准确回答涉及汇总的问题。例如,您可以向 Look Graph 代理提出以下问题:
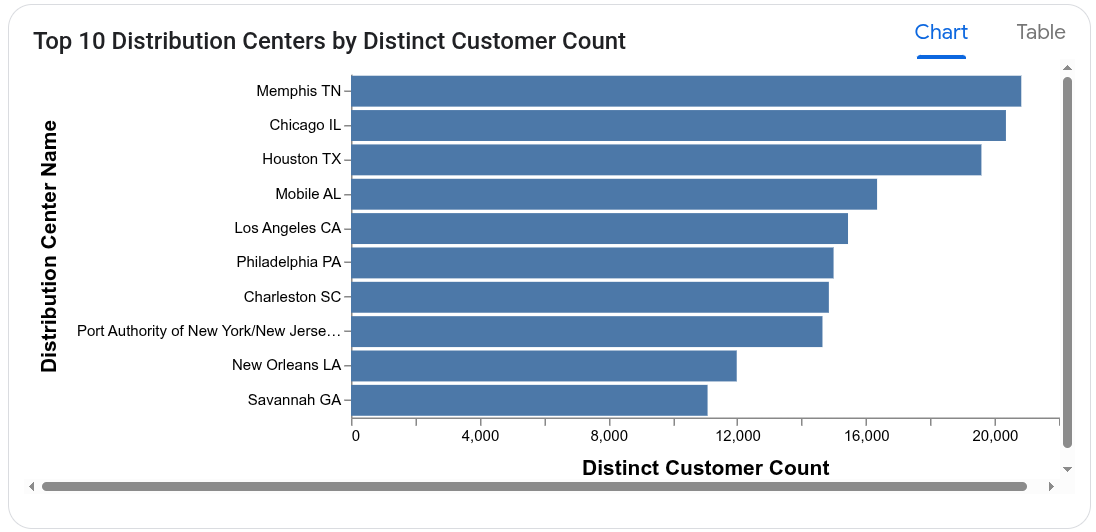
Which distribution centers process orders from the largest number of distinct customers?
智能体使用 User 节点上的 user_count 指标来避免过高估计客户数量。用于计算响应的查询可能类似于以下内容:
SELECT
  DistributionCenter_id,
  DistributionCenter_name,
  AGG(User_user_count) AS distinct_customer_count
FROM
  GRAPH_EXPAND("bigquery-public-data.thelook_ecommerce.graph")
GROUP BY
  DistributionCenter_id,
  DistributionCenter_name
ORDER BY
  distinct_customer_count DESC;
代理还可能会提供图表可视化效果。