
Regulated industries like finance and healthcare need to monitor critical infrastructure while keeping data strictly within regional boundaries.
Open-source software (OSS) can complement and extend the Cloud Monitoring and Cloud Logging features currently available in Cloud de Confiance by S3NS. This example shows you how to create a complete sovereign observability solution on Cloud de Confiance by S3NS by adding widely used open source tools.
The architecture uses OpenTelemetry, Grafana Mimir and Grafana Loki (backed by Cloud Storage), Grafana, and Fluent Bit to generate metrics, logs, visualizations, and alerts for Google Kubernetes Engine (GKE) and Compute Engine. All data stays within the sovereign region, and avoids third-party SaaS fees.
We recommend that you subscribe to the relevant release notes for future updates to the Cloud de Confiance by S3NS observability capabilities.
You can deploy this solution by following the accompanying reference implementation with Terraform.
Target audience
This solution is for companies that need to monitor workloads in sovereign Cloud de Confiance by S3NS environments. It serves the following stakeholders:
- Site reliability engineers (SREs) and DevOps leaders who provision automated, scalable metrics storage and log pipelines to monitor application health and track system service level agreements (SLAs) without manual exporter maintenance.
- Compliance and security officers who ensure that sensitive application logs, metrics, and operational signals remain localized within sovereign boundary and avoid non-sovereign SaaS data outflow.
- Enterprise cloud architects who establish a standardized OpenTelemetry foundation that unblocks immediate cloud migrations and provides a smooth transition path to first-party cloud monitoring.
Core capabilities
- Sovereign observability and local data retention: Collect, process, and store application metrics for Compute Engine and GKE logs within the local sovereign infrastructure using Cloud Storage buckets.
- OpenTelemetry standard ingestion: Use OpenTelemetry collectors for pull-based Prometheus scraping and push-based OpenTelemetry Protocol (OTLP) metrics ingestion. This approach supports future compatibility with first-party cloud monitoring.
- Scalable Cloud Storage-backed metric storage: Configure Grafana Mimir and Grafana Loki to use Cloud Storage as a highly available, cost-effective Prometheus metric block backend.
- Unified telemetry visualization: View pre-configured Grafana dashboards that display real-time application metrics, Grafana Loki log streams, Compute Engine VM stdout logs, and integrate Cloud Logging datasources.
- Compute Engine VM logging pipeline: Install Fluent Bit and
OpenTelemetry Collector Contrib automatically on Compute Engine VMs
to stream
systemd-journaldand stdout logs to Grafana Loki, Cloud Logging, or both. You can also collect VM host metrics and synthetic OTLP application metrics to forward over mTLS to Mimir. - Flexible deployment automation: Use an Infrastructure as Code (IaC) approach of Terraform and Kubernetes package management with Helm for consistent environment setup and teardown.
Architecture
This architecture uses OpenTelemetry collectors, Grafana Mimir, Grafana Loki,
kube-state-metrics, Fluent Bit, cert-manager, and Grafana to monitor
Compute Engine and GKE workloads with
Cloud Storage for metrics and Cloud Logging for logs. Mimir and Loki
inside the Virtual Private Cloud (VPC) use internal Application Load Balancer over mTLS so that
Compute Engine VMs can push metrics and logs. Grafana is exposed
externally over HTTPS using a regional GKE Gateway.
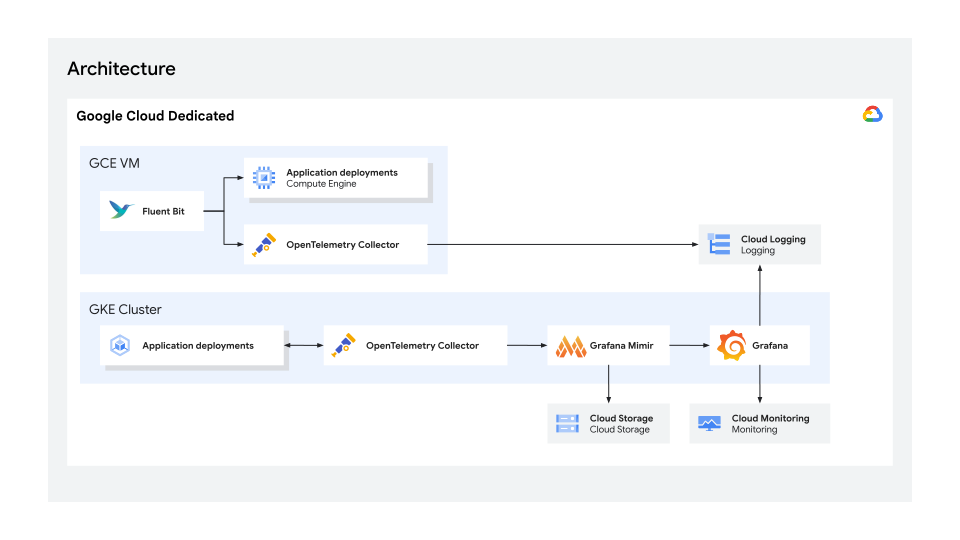
Components
| Component | Tech | Purpose |
|---|---|---|
| Telemetry collector | OpenTelemetry collector | Central telemetry pipeline to process OpenTelemetry Protocol (OTLP) HTTP/gRPC metrics, scrape Prometheus endpoints, and forward to Mimir. |
| Metrics database | Grafana Mimir | Highly available, long-term Prometheus metric storage database with persistent blocks in Cloud Storage. |
| Logs database | Grafana Loki | Horizontally scalable, multi-tenant log aggregation database persisting chunks and TSDB indexes in Cloud Storage. |
| Object storage | Cloud Storage | Provisions dedicated buckets for Mimir metrics, Loki logs, and shared monitoring artifacts. |
| Cluster state Metrics | kube-state-metrics
|
Listens to the Kubernetes API
server and generates metrics
about the state of cluster
objects (like Deployments, nodes,
or Pods). Scraped by the
OpenTelemetry Collector using
ServiceMonitor. |
| PKI and certificates | cert-manager & PKI
issuer
|
Bootstraps an internal Root CA
and ClusterIssuer to issue TLS /
mTLS certificates for in-cluster
components and standalone
Compute Engine VMs. |
| Google Kubernetes Engine log Collector | Fluent Bit (DaemonSet) | Collects container stdout logs across GKE nodes, enriches with Kubernetes metadata, and forwards using OTLP mTLS to the GKE OTel Collector. |
| VM log collector | Fluent Bit and OpenTelemetry Contrib | Collects OS and application
stdout logs on standalone
Compute Engine VMs using
systemd-journald and streams to
Cloud Logging. |
| Central logging | Cloud Logging | Centralized logging sink for Compute Engine VM and platform logs. |
| Visualization and alerting | Grafana | Dashboard visualization layer pre-configured with datasources for Mimir, Grafana Loki, Cloud Monitoring, and Cloud Logging. |
| Push demo app | Python (beacon app) | Demo microservice that emits synthetic OTLP metrics pushed to OpenTelemetry collector every 5 seconds. |
| Pull demo app | Python (sensor app) | Demo microservice to expose a
standard /metrics Prometheus
endpoint scraped by
OpenTelemetry collector. |
| Demo app | Python | Demo application running on Compute Engine VMs to produce structured JSON logs to stdout. |
| Deployment | Terraform and Helm | Automates Virtual Private Cloud, GKE cluster, Cloud Storage bucket, Identity and Access Management (IAM) roles, Compute Engine VM, and Helm chart deployment. |
Reference implementation
A reference implementation of this solution with Terraform is provided in GitHub. Note that this is a proof-of-concept prototype built for demonstration purposes, and the implementation is not audited or secured for production use cases.
For prerequisites and deployment instructions, see Sovereign observability and monitoring with Grafana and OpenTelemetry.