
本教程介绍了如何将 AI.FORECAST 函数与 BigQuery ML 内置的 TimesFM 单变量模型搭配使用,根据给定列的历史值来预测该列的未来值。
本教程使用来自公开的 bigquery-public-data.san_francisco_bikeshare.bikeshare_trips 表中的数据。
目标
本教程将引导您使用 AI.FORECAST 函数和内置的 TimesFM 模型来预测共享单车行程。前两个部分介绍了如何预测单个时序并直观呈现结果。第三部分介绍了如何预测多个时序。
费用
本教程使用 Cloud de Confiance by S3NS的可计费组件,包括以下组件:
- BigQuery
- BigQuery ML
如需详细了解 BigQuery 费用,请参阅 BigQuery 价格页面。
如需详细了解 BigQuery ML 费用,请参阅 BigQuery ML 价格。
准备工作
-
In the Cloud de Confiance console, on the project selector page, select or create a Cloud de Confiance project.
Roles required to select or create a project
- Select a project: Selecting a project doesn't require a specific IAM role—you can select any project that you've been granted a role on.
-
Create a project: To create a project, you need the Project Creator role
(
roles/resourcemanager.projectCreator), which contains theresourcemanager.projects.createpermission. Learn how to grant roles.
-
Verify that billing is enabled for your Cloud de Confiance project.
- 新项目会自动启用 BigQuery。如需在预先存在的项目中激活 BigQuery,请
Enable the BigQuery API.
Roles required to enable APIs
To enable APIs, you need the Service Usage Admin IAM role (
roles/serviceusage.serviceUsageAdmin), which contains theserviceusage.services.enablepermission. Learn how to grant roles.
预测单个共享单车行程时序
使用 AI.FORECAST 函数预测未来的时序值。
以下查询根据前四个月的历史数据,预测下个月(大约 720 小时)每小时的订阅方共享单车行程数。confidence_level 参数表示查询会生成置信度为 95% 的预测区间。
请按照以下步骤使用 TimesFM 模型预测数据:
在 Cloud de Confiance 控制台中,前往 BigQuery 页面。
在查询编辑器中,粘贴以下查询,然后点击运行:
SELECT *
FROM
  AI.FORECAST(
    (
      SELECT TIMESTAMP_TRUNC(start_date, HOUR) as trip_hour, COUNT(*) as num_trips
FROM `bigquery-public-data.san_francisco_bikeshare.bikeshare_trips`
WHERE subscriber_type = 'Subscriber' AND start_date >= TIMESTAMP('2018-01-01')
GROUP BY TIMESTAMP_TRUNC(start_date, HOUR)
    ),
    horizon => 720,
    confidence_level => 0.95,
    timestamp_col => 'trip_hour',
    data_col => 'num_trips');
结果类似于以下内容:
+-------------------------+-------------------+------------------+---------------------------------+---------------------------------+--------------------+
| forecast_timestamp      | forecast_value    | confidence_level | prediction_interval_lower_bound | prediction_interval_upper_bound | ai_forecast_status |
+-------------------------+-------------------+------------------+---------------------------------+---------------------------------+--------------------+
| 2018-05-01 00:00:00 UTC | 26.3045959...     |            0.95  | 21.7088378...                   | 30.9003540...                   |                    |
+-------------------------+-------------------+------------------+---------------------------------+---------------------------------+--------------------+
| 2018-05-01 01:00:00 UTC | 34.0890502...     |            0.95  | 2.47682913...                   | 65.7012714...                   |                    |
+-------------------------+-------------------+------------------+---------------------------------+---------------------------------+--------------------+
| 2018-05-01 02:00:00 UTC | 24.2154693...     |            0.95  | 2.87621605...                   | 45.5547226...                   |                    |
+-------------------------+-------------------+------------------+---------------------------------+---------------------------------+--------------------+
| ...                     | ...               |  ...             | ...                             |  ...                            |                    |
+-------------------------+-------------------+------------------+---------------------------------+---------------------------------+--------------------+
将预测数据与输入数据进行比较
将 AI.FORECAST 函数输出与函数输入数据的一部分一起绘制成图表,以查看它们的比较情况。
请按照以下步骤绘制函数输出的图表:
在 Cloud de Confiance 控制台中,前往 BigQuery 页面。
在查询编辑器中,粘贴以下查询,然后点击运行:
WITH historical AS (
SELECT TIMESTAMP_TRUNC(start_date, HOUR) as trip_hour, COUNT(*) as num_trips
FROM `bigquery-public-data.san_francisco_bikeshare.bikeshare_trips`
WHERE subscriber_type = 'Subscriber' AND start_date >= TIMESTAMP('2018-01-01')
GROUP BY TIMESTAMP_TRUNC(start_date, HOUR)
ORDER BY TIMESTAMP_TRUNC(start_date, HOUR)
)
SELECT *
FROM
(
(SELECT
    trip_hour as date,
    num_trips AS historical_value,
    NULL as forecast_value,
    'historical' as type,
    NULL as prediction_interval_lower_bound,
    NULL as prediction_interval_upper_bound
FROM
    historical
ORDER BY historical.trip_hour DESC
LIMIT 400)
UNION ALL
(SELECT forecast_timestamp AS date,
        NULL as historical_value,
        forecast_value as forecast_value,
        'forecast' as type,
        prediction_interval_lower_bound,
        prediction_interval_upper_bound
FROM
    AI.FORECAST(
    (
    SELECT * FROM historical
    ),
    horizon => 720,
    confidence_level => 0.99,
    timestamp_col => 'trip_hour',
    data_col => 'num_trips')))
ORDER BY date asc;
查询运行完毕后,点击查询结果窗格中的可视化图表标签页。生成的图表如下所示:
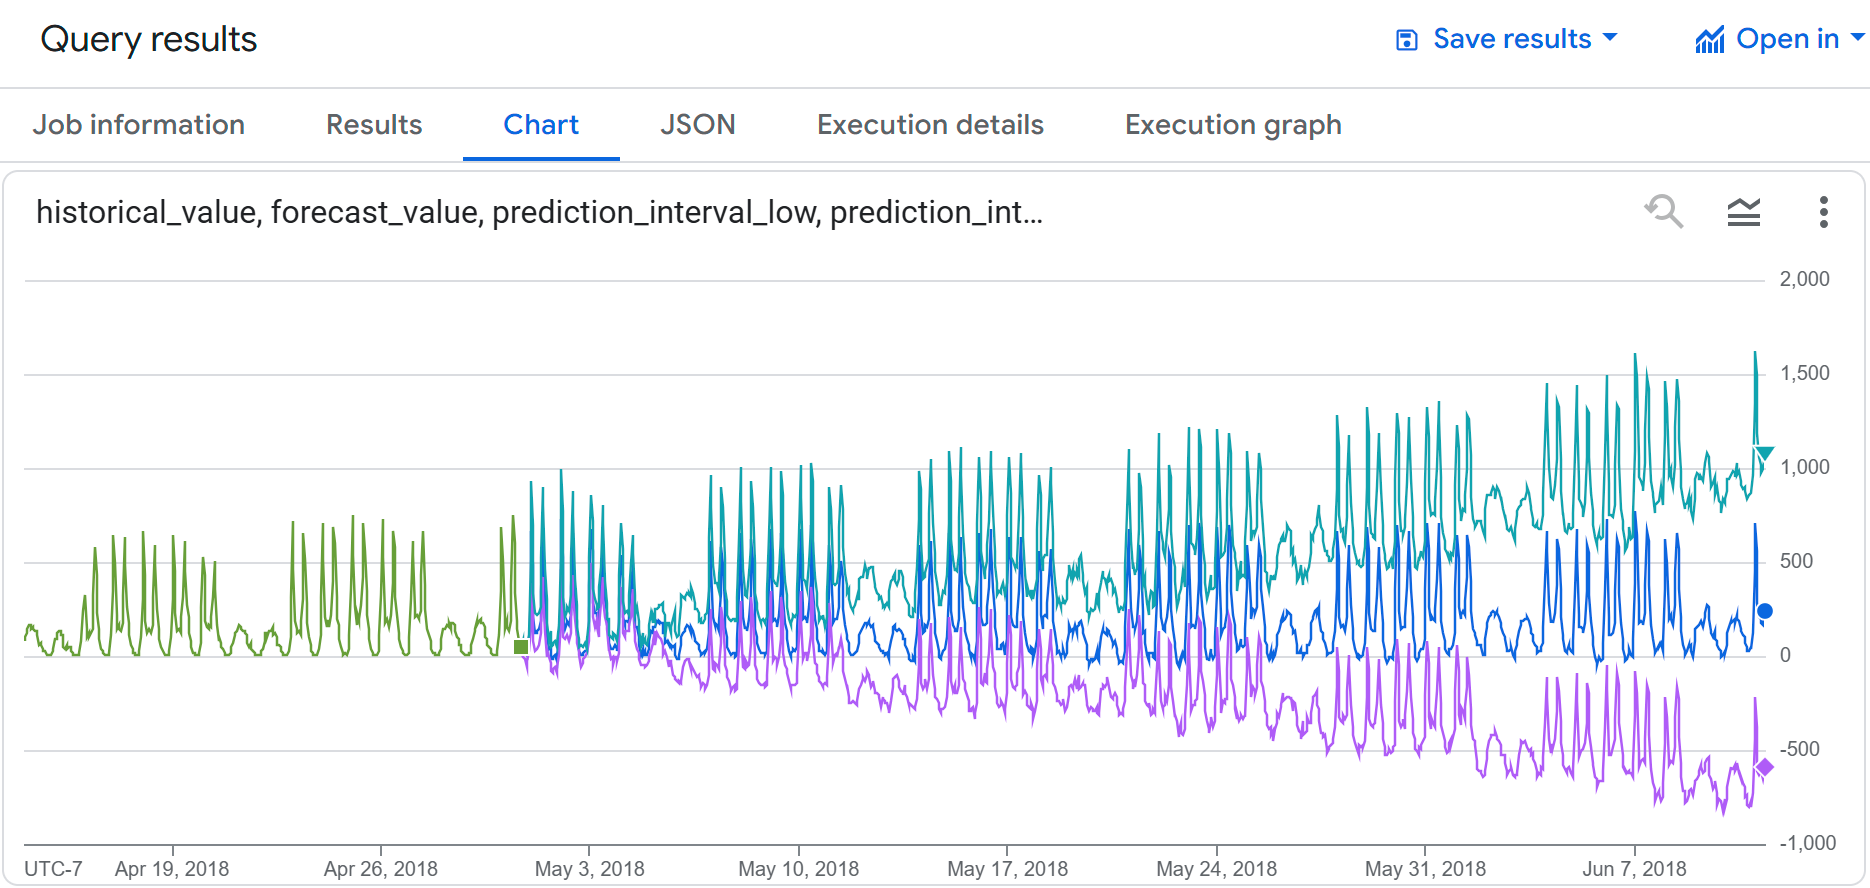
您可以看到,输入数据和预测数据都显示了类似的共享单车使用情况。您还可以看到,随着预测时间点越来越靠后,预测区间的下限和上限也会随之增加。
预测多个共享单车行程时序
以下查询根据前四个月的历史数据,预测下个月(大约 720 小时)每种订阅方类型每小时的共享单车行程数。confidence_level 参数表示查询会生成置信度为 95% 的预测区间。
请按照以下步骤使用 TimesFM 模型预测数据:
在 Cloud de Confiance 控制台中,前往 BigQuery 页面。
在查询编辑器中,粘贴以下查询,然后点击运行:
SELECT *
FROM
  AI.FORECAST(
    (
      SELECT TIMESTAMP_TRUNC(start_date, HOUR) as trip_hour, subscriber_type, COUNT(*) as num_trips
      FROM `bigquery-public-data.san_francisco_bikeshare.bikeshare_trips`
      WHERE start_date >= TIMESTAMP('2018-01-01')
      GROUP BY TIMESTAMP_TRUNC(start_date, HOUR), subscriber_type
    ),
    horizon => 720,
    confidence_level => 0.95,
    timestamp_col => 'trip_hour',
    data_col => 'num_trips',
    id_cols => ['subscriber_type']);
结果类似于以下内容:
+---------------------+--------------------------+------------------+------------------+---------------------------------+---------------------------------+--------------------+
| subscriber_type     | forecast_timestamp       | forecast_value   | confidence_level | prediction_interval_lower_bound | prediction_interval_upper_bound | ai_forecast_status |
+---------------------+--------------------------+------------------+------------------+---------------------------------+---------------------------------+--------------------+
| Subscriber          | 2018-05-01 00:00:00 UTC  | 26.3045959...    |            0.95  | 21.7088378...                   | 30.9003540...                   |                    |
+---------------------+--------------------------+------------------+------------------+---------------------------------+---------------------------------+--------------------+
| Subscriber          |  2018-05-01 01:00:00 UTC | 34.0890502...    |            0.95  | 2.47682913...                   | 65.7012714...                   |                    |
+---------------------+-------------------+------------------+-------------------------+---------------------------------+---------------------------------+--------------------+
| Subscriber          |  2018-05-01 02:00:00 UTC | 24.2154693...    |            0.95  | 2.87621605...                   | 45.5547226...                   |                    |
+---------------------+--------------------------+------------------+------------------+---------------------------------+---------------------------------+--------------------+
| ...                 | ...                      |  ...             | ...              | ...                             |  ...                            |                    |
+---------------------+--------------------------+------------------+------------------+---------------------------------+---------------------------------+--------------------+
清理
为避免因本教程中使用的资源导致您的 Google Cloud 账号产生费用,请删除包含这些资源的项目,或者保留项目但删除各个资源。
删除项目
如需删除项目,请执行以下操作:
- In the Cloud de Confiance console, go to the Manage resources page.
- In the project list, select the project that you want to delete, and then click Delete.
- In the dialog, type the project ID, and then click Shut down to delete the project.
后续步骤
- 如需大致了解 BigQuery ML,请参阅 BigQuery 中的 AI 和机器学习简介。