
그래프와 채팅
대화형 분석을 사용하여 그래프에 대해 질문할 수 있습니다. 에이전트는 SQL 쿼리를 작성하고 출력의 시각화를 제공할 수 있습니다. 에이전트는 그래프에 정의된 설명, 동의어, 측정항목을 사용하여 결과의 품질을 개선할 수도 있습니다. Enterprise 또는 Enterprise Plus 버전을 사용하는 경우 에이전트가 그래프에서 GQL 쿼리를 실행할 수 있습니다. 주문형 가격 책정을 사용하는 경우 에이전트가 GRAPH_EXPAND 함수를 호출하여 그래프에서 SQL 쿼리를 실행할 수 있습니다.
그래프는 테이블 간의 관계를 인코딩합니다. 에이전트에 그래프를 제공하면 테이블의 관계에 대한 모호성이 사라집니다. 이러한 명확성은 허위 정보를 줄이고 대화의 효율성을 개선할 수 있습니다.
예를 들어 공개적으로 사용 가능한 Look 전자상거래 그래프에 대해 에이전트에게 질문하려면 다음 단계를 따르세요.
콘솔에서 BigQuery 에이전트 페이지로 이동합니다. Cloud de Confiance
에이전트 카탈로그 탭을 선택합니다.
Google의 샘플 에이전트 섹션에서 Look 그래프 를 클릭합니다.
대화가 열립니다.
bigquery-public-data.thelook_ecommerce.graph그래프에 대한 질문을 입력할 수 있습니다.
제한사항
- 에이전트 또는 대화당 최대 하나의 그래프를 데이터 소스로 사용할 수 있습니다.
- 테이블과 그래프를 데이터 소스로 결합할 수 없습니다.
그래프와 채팅
그래프와 채팅하려면
그래프를 데이터 소스로 사용하는 데이터 에이전트를 만들거나 그래프와
직접 대화를 만들면 됩니다. 무엇을 질문해야 할지 잘 모르겠다면
What questions can I ask about this data?라고 질문해 보세요. 예를 들어 Look 이커머스 그래프에 대해 이
질문을 하면
응답에 그래프 스키마 개요와 추천 질문이 포함됩니다. 응답에 다음 질문이 표시될 수 있습니다.
비즈니스 성과
What is the total revenue for each product category, sorted from highest to lowest?What are the top 5 brands by total revenue among users from 'Brasil'?Rank the product categories based on their total revenue for each product department (Men/Women).
사용자 및 물류 통계
How many users do we have in each country?What is the distribution of user ages in the United States?Which distribution centers handle the most orders with a 'Complete' status?
관계 분석
Show the connection between users and the distribution centers their products are shipped from.Find all products that have been ordered by users who came from a 'Search' traffic source.
그래프 쿼리 및 시각화 만들기
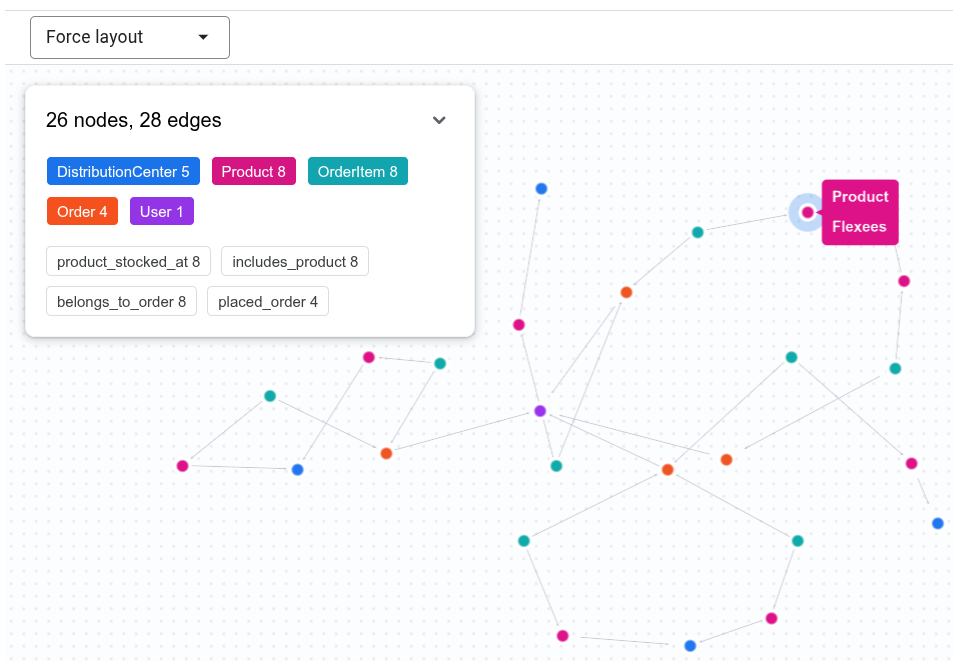
대화형 분석은 GQL 쿼리를 작성하여 그래프에 대한 질문에 답변하고 출력을 시각화로 표시할 수 있습니다. 예를 들어 채팅에
Show the connection between Tina Fletcher's orders and distribution centers
을 입력할 수 있습니다. 에이전트는 다음과 유사한 GQL 쿼리를 실행할 수 있습니다.
GRAPH `bigquery-public-data.thelook_ecommerce.graph`
MATCH p = (u:User {id: 32})
          <-[:placed_order]-(o:`Order`)
          <-[:belongs_to_order]-(oi:OrderItem)
          -[:includes_product]->(pr:Product)
          -[:product_stocked_at]->(dc:DistributionCenter)
RETURN TO_JSON(p) AS path;
에이전트는 대화형 시각화를 제공할 수도 있습니다.
그래프 측정항목 사용
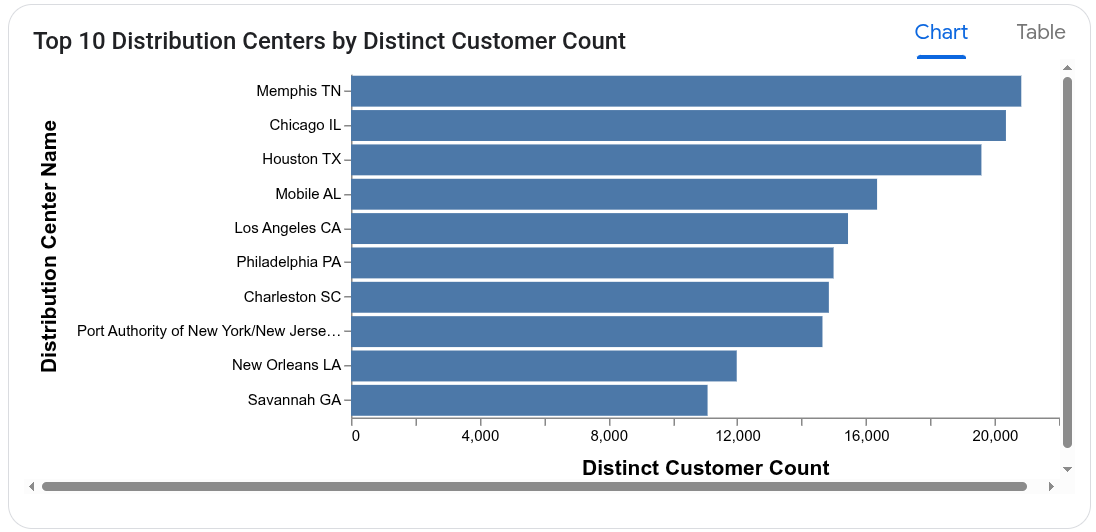
대화형 분석은 그래프에 정의된 측정항목을 사용하여 집계와 관련된 질문에 정확하게 답변할 수 있습니다. 예를 들어 Look Graph 에이전트에게 다음 질문을 할 수 있습니다.Which distribution centers process orders from the largest number of distinct customers?
에이전트는 User 노드에서 user_count 측정항목을 사용하여 고객 수를 과도하게 집계하지 않습니다. 응답을 계산하는 데 사용되는 쿼리는 다음과 유사할 수 있습니다.
SELECT
  DistributionCenter_id,
  DistributionCenter_name,
  AGG(User_user_count) AS distinct_customer_count
FROM
  GRAPH_EXPAND("bigquery-public-data.thelook_ecommerce.graph")
GROUP BY
  DistributionCenter_id,
  DistributionCenter_name
ORDER BY
  distinct_customer_count DESC;
에이전트는 차트 시각화를 제공할 수도 있습니다.
다음 단계
- 대화형 분석에 대해 자세히 알아보세요.
- 그래프 쿼리 작성에 대해 자세히 알아보세요.
- 그래프 스키마 설계에 대해 자세히 알아보세요.
- 그래프 시각화에 대해 자세히 알아보세요.